G2C::Genetics
PSD-93/S-SCAM knock-out mouse
S.G.N. Grant and the G2C Consortium
Corresponding email: Seth.Grant@ed.ac.uk
G2CMine Data Warehouse
| Dlg2+Magi2 @ G2CMine |
Genetic and Genomic Information
| Gene symbol | Dlg2 | Magi2 |
| MGI ID | MGI:1344351 | MGI:1354953 |
| G2Cdb mouse | G00000010 | G00003296 |
| Ensembl mouse | ENSMUSG00000052572 | ENSMUSG00000040003 |
| G2Cdb human | G00000035 | G00006286 |
| Ensembl human | ENSG00000150672 | ENSG00000187391 |
G2CMine Data Warehouse
G2CMine integrates the scientific findings of the Genes to Cognition Programme that utilised neuroproteomics, psychiatric genetics, high-throughput mouse gene targeting combined with behavioural and electrophysiological phenotyping and informatics in order to develop a general strategy for understanding cognition at the molecular, cellular and systems neuroscience levels.
G2CMine provides comprehensive Gene Ontology, Mammalian Phenotype Ontology, Human Phenotype Ontology, UniProt, genetic and protein interactions, and regional mouse brain expression results, together with the phenotyping results of the G2C Programme.
Mutation
This line harboured two mutations, a heterozygous knockout of Magi2 and homozygous knockout of Dlg2, derived from two G2C lines.Genotyping
Primers and other genotyping information can be obtained from each respective G2C line.Expression
Expression effects of mutation for both genes can be obtained from the respective G2C lines.Breeding
The compound colony consisted of knockouts of Magi2 and Dlg2. Magi2-/- mice were known to be sub-viable so Dlg2-/- x Magi2+/- were generated for phenotypic analysis. 1007 pups were produced of which 918 (91.2%) survived to 3 weeks. The colony was maintained on a mixed C57BL/6J x 129S5/SvEvBrd background. Genotypes of 3-week-old pups from Dlg2+/- x Magi2+/- intercrosses identified the following frequencies, which, other than lethality of mice carrying homozygous mutations at the Magi2 locus, conformed to approximately Mendelian ratios (Χ2 test p = 0.023):
Overview
Mutant mice showed medium overall behavioural difference from wildtypes, with six of 16 behaviour variables significantly impacted in these mutants. In the elevated plus maze task, four behavioural variables of five were significantly impacted in mutants. In the open field/novel object exploration task, one behavioural variable, OF NOE total distance, was significantly decreased in mutants. In the rotarod task, one behavioural variable, RR learning, was significantly decreased in mutants. Fear learning, contextual memory and cued memory tasks were unaffected. Definitions of variables may be found below.

Variables shown are: EPM total distance, Total distance (cm) travelled in any arm or central zone of the EPM. EPM max speed, Maximum speed (cm/s) travelled in any arm or central zone of the EPM. EPM % time in open, Percentage of time in the open or closed arms of the EPM spent in open arms. EPM time in centre, Total time (s) spent in the central zone of the EPM. EPM max speed, open vs closed, Difference between the maximum speed (cm/s) observed in the open arms and the closed arms of the EPM. OF, NOE total distance, Total distance travelled (log₁₀ cm) during initial exposure to the open field and in presence of the novel object. NOE vs OF distance travelled, Difference in distance travelled (cm) in presence of the novel object and during initial exposure to open field. RR naive fall time, Fall time on accelerating rotarod (log₁₀ s), naive performance in session 1. RR learning, Learning on rotarod, measured as increase in fall time per trial (s/trial) in session 1. RR memory, Memory on rotarod, measured as excess fall time at middle of session 2 relative to middle of session 1. Fear learning, trial effect, Fear learning, measured as extra % time freezing before third trial compared to % time freezing before first trial. Fear learning, tone effect, Fear learning, measured as increase in % time freezing due to third tone compared to increase in % time freezing due to first tone. Contextual memory, mean, Contextual memory, measured as difference in % time freezing during first 120 s re-exposure to the box compared to first 120 s in the box on previous day. Contextual memory, change, Contextual memory, measured as increase in % time spent freezing from first time bin of 30 s to fourth bin of 30 s during 120 s re-exposure to the box. Cued memory, mean, Cued memory, measured as increase in % time spent freezing during 120 s of tone re-exposure compared to increase in % time spent freezing during initial tone on previous day. Cued memory, change, Cued memory, measured as increase in % time spent freezing from first time bin of 30 s to fourth bin of 30 s during 120 s re-exposure to the tone.
| Variable | Units | Wildtype M (n=6) | Wildtype F (n=10) | Mutant M (n=11) | Mutant F (n=16) | P(sex×mutation) | P(mutation) |
|---|---|---|---|---|---|---|---|
| EPM total distance | cm | 978 (95) | 879 (96) | 589 (59) | 704 (49) | 0.16 | 0.00099 *** |
| EPM max speed | cm/s | 20.8 (0.7) | 19.6 (1.4) | 15.8 (1) | 15.8 (0.7) | 0.61 | 0.0003 *** |
| EPM % time in open | % | 0.8 (0.3) | 14.9 (4.9) | 18 (7.1) | 9.5 (2.6) | 0.029 * | 0.5 |
| EPM time in centre | s | 41.5 (8.1) | 88 (18) | 147.1 (26.5) | 109.1 (14.4) | 0.048 * | 0.011 * |
| EPM max speed, open vs closed | cm/s | -14.9 (1.1) | -9.2 (2) | -7.7 (1.7) | -7.1 (1.2) | 0.14 | 0.015 * |
| OF, NOE total distance | log10 cm | 3.16 (0.12) | 3.25 (0.1) | 2.94 (0.05) | 3.01 (0.06) | 0.92 | 0.0049 ** |
| NOE vs OF distance travelled | cm | 67 (198) | -340 (158) | -182 (96) | -154 (85) | 0.1 | 0.89 |
| RR naive fall time | log10 s | 0.92 (0.11) | 1.08 (0.15) | 1.12 (0.07) | 1.14 (0.08) | 0.52 | 0.31 |
| RR learning | s/trial | 0.2 (0.4) | 1.7 (0.7) | 0.1 (0.7) | -0.8 (0.3) | 0.04 * | 0.0068 ** |
| RR memory | s | 5.4 (1.9) | 4.9 (3.6) | 3.6 (3.2) | 5.4 (2.3) | 0.71 | 0.9 |
| Fear learning, trial effect | % freezing | 29.9 (14.7) | 51.4 (10.9) | 38.2 (8.8) | 32.1 (8.4) | 0.21 | 0.41 |
| Fear learning, tone effect | % freezing | 14.1 (15.7) | -3 (15.3) | 9.3 (9.3) | 13.7 (7.2) | 0.36 | 0.46 |
| Contextual memory, mean | % freezing | 49.7 (9.1) | 43.1 (8.9) | 46.1 (9.1) | 39.1 (6) | 0.98 | 0.65 |
| Contextual memory, change | % freezing | 15.5 (14.9) | 12.9 (7.1) | 20.4 (6.6) | 12.6 (9.6) | 0.8 | 0.87 |
| Cued memory, mean | % freezing | -6.1 (9.5) | -12.2 (14.4) | -7 (7.9) | -1.9 (5.3) | 0.56 | 0.53 |
| Cued memory, change | % freezing | -17.6 (5) | -14.8 (9.6) | -11.8 (9.5) | -12.3 (5.6) | 0.85 | 0.65 |
Elevated Plus Maze
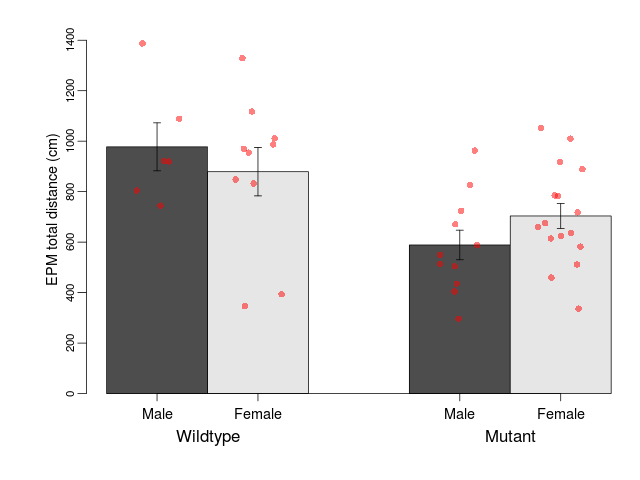
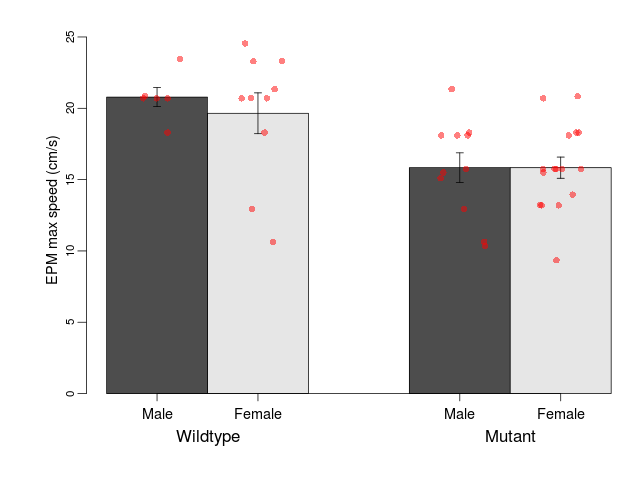
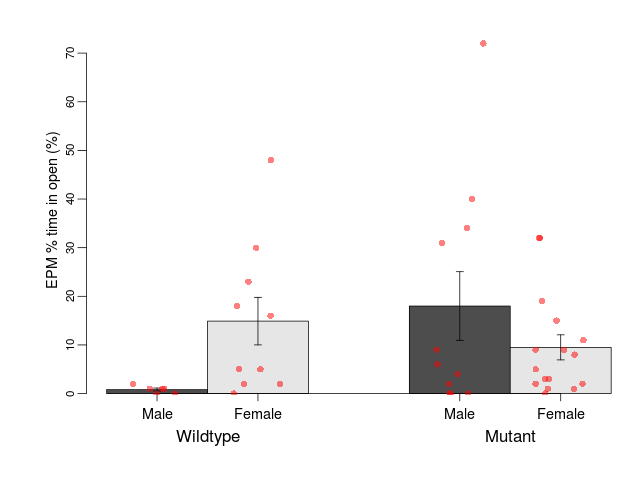
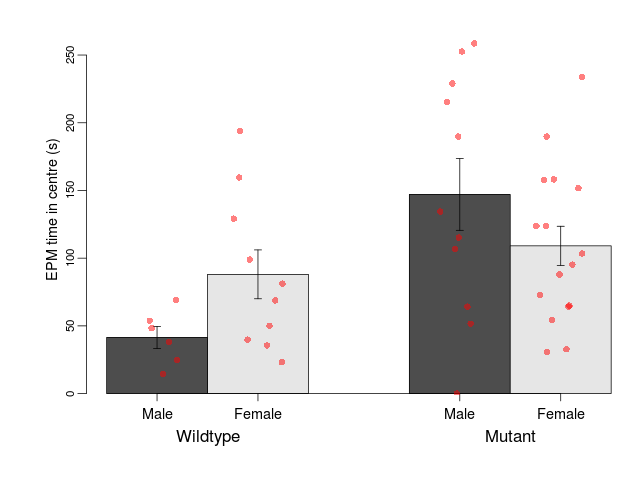
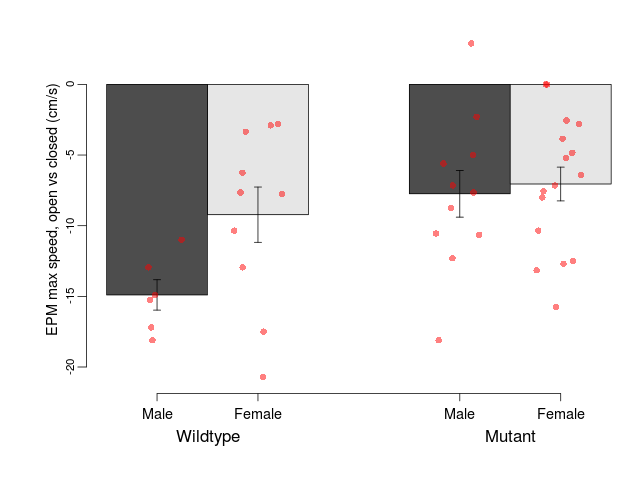
Variables shown are: EPM total distance, Total distance (cm) travelled in any arm or central zone of the EPM. EPM max speed, Maximum speed (cm/s) travelled in any arm or central zone of the EPM. EPM % time in open, Percentage of time in the open or closed arms of the EPM spent in open arms. EPM time in centre, Total time (s) spent in the central zone of the EPM. EPM max speed, open vs closed, Difference between the maximum speed (cm/s) observed in the open arms and the closed arms of the EPM.
| Variable | Units | Wildtype M (n=6) | Wildtype F (n=10) | Mutant M (n=11) | Mutant F (n=16) | P(sex×mutation) | P(mutation) |
|---|---|---|---|---|---|---|---|
| EPM total distance | cm | 978 (95) | 879 (96) | 589 (59) | 704 (49) | 0.16 | 0.00099 *** |
| EPM max speed | cm/s | 20.8 (0.7) | 19.6 (1.4) | 15.8 (1) | 15.8 (0.7) | 0.61 | 0.0003 *** |
| EPM % time in open | % | 0.8 (0.3) | 14.9 (4.9) | 18 (7.1) | 9.5 (2.6) | 0.029 * | 0.5 |
| EPM time in centre | s | 41.5 (8.1) | 88 (18) | 147.1 (26.5) | 109.1 (14.4) | 0.048 * | 0.011 * |
| EPM max speed, open vs closed | cm/s | -14.9 (1.1) | -9.2 (2) | -7.7 (1.7) | -7.1 (1.2) | 0.14 | 0.015 * |
Open Field/Novel Object
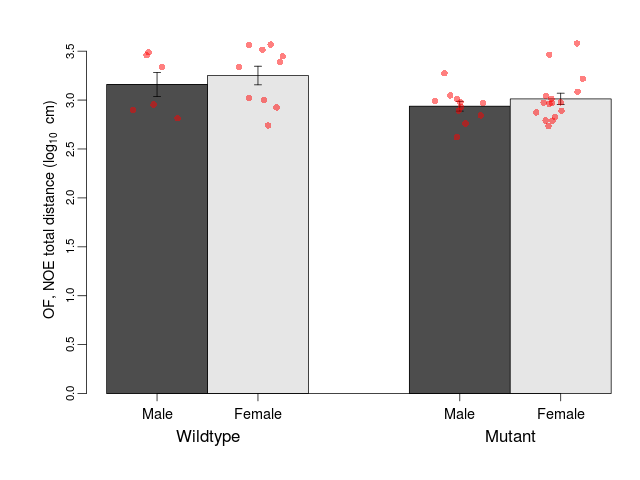
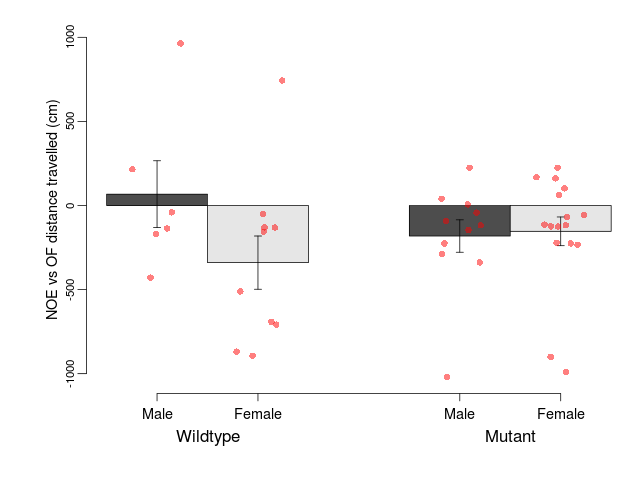
Variables shown are: OF, NOE total distance, Total distance travelled (log₁₀ cm) during initial exposure to the open field and in presence of the novel object. NOE vs OF distance travelled, Difference in distance travelled (cm) in presence of the novel object and during initial exposure to open field.
| Variable | Units | Wildtype M (n=6) | Wildtype F (n=10) | Mutant M (n=11) | Mutant F (n=16) | P(sex×mutation) | P(mutation) |
|---|---|---|---|---|---|---|---|
| OF, NOE total distance | log10 cm | 3.16 (0.12) | 3.25 (0.1) | 2.94 (0.05) | 3.01 (0.06) | 0.92 | 0.0049 ** |
| NOE vs OF distance travelled | cm | 67 (198) | -340 (158) | -182 (96) | -154 (85) | 0.1 | 0.89 |
Rotarod
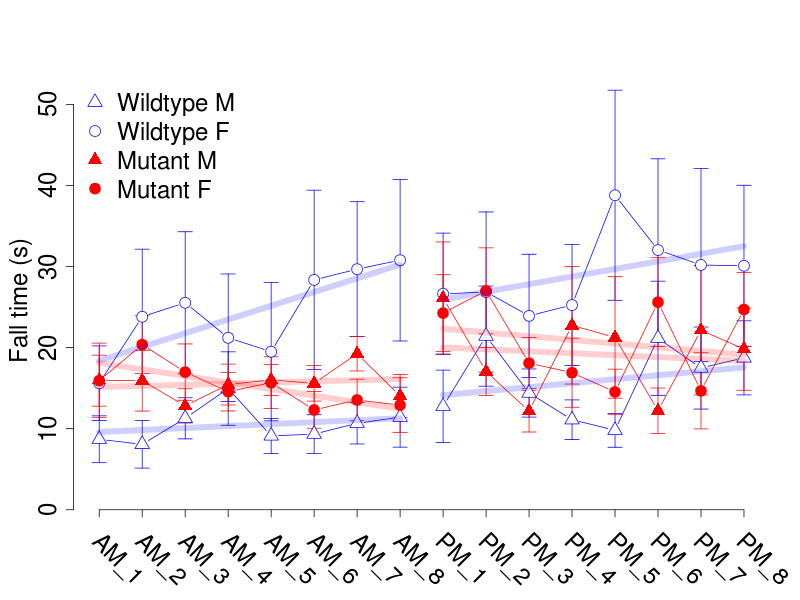
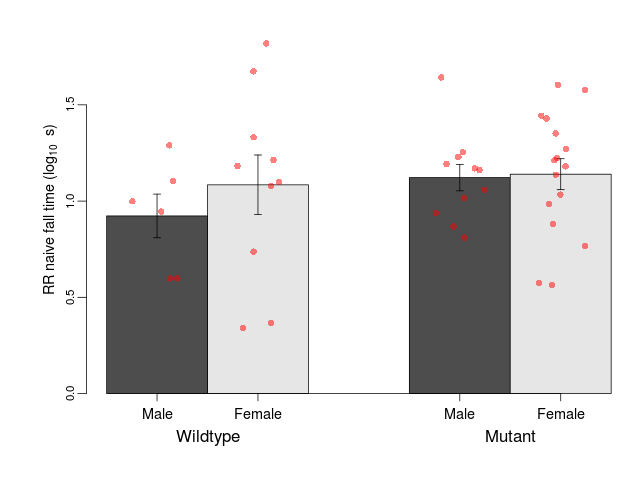
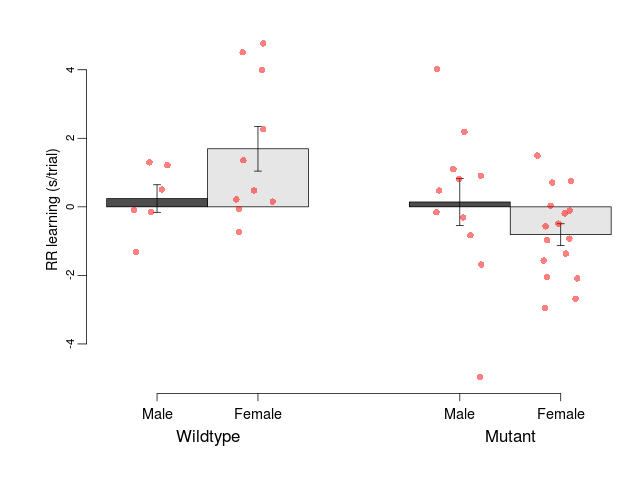

Variables shown are: RR naive fall time, Fall time on accelerating rotarod (log₁₀ s), naive performance in session 1. RR learning, Learning on rotarod, measured as increase in fall time per trial (s/trial) in session 1. RR memory, Memory on rotarod, measured as excess fall time at middle of session 2 relative to middle of session 1.
| Variable | Units | Wildtype M (n=6) | Wildtype F (n=10) | Mutant M (n=11) | Mutant F (n=16) | P(sex×mutation) | P(mutation) |
|---|---|---|---|---|---|---|---|
| RR naive fall time | log10 s | 0.92 (0.11) | 1.08 (0.15) | 1.12 (0.07) | 1.14 (0.08) | 0.52 | 0.31 |
| RR learning | s/trial | 0.2 (0.4) | 1.7 (0.7) | 0.1 (0.7) | -0.8 (0.3) | 0.04 * | 0.0068 ** |
| RR memory | s | 5.4 (1.9) | 4.9 (3.6) | 3.6 (3.2) | 5.4 (2.3) | 0.71 | 0.9 |
Fear Conditioning

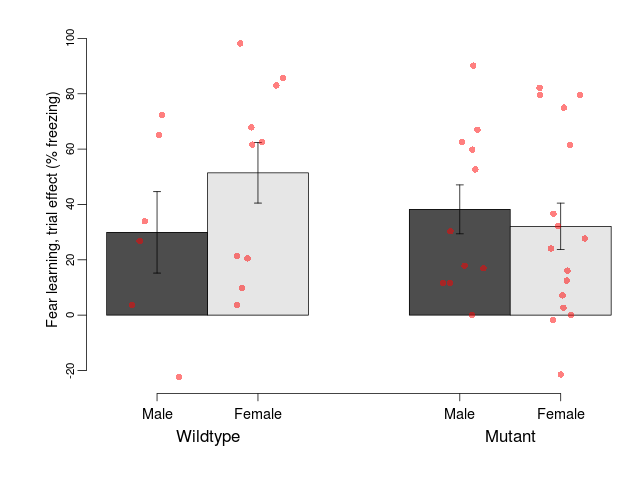
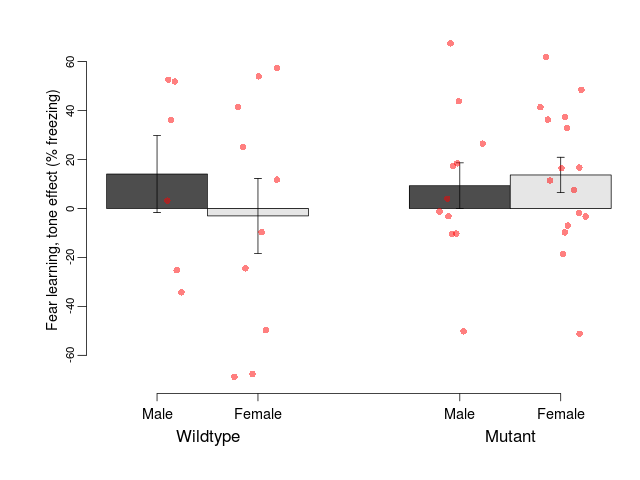
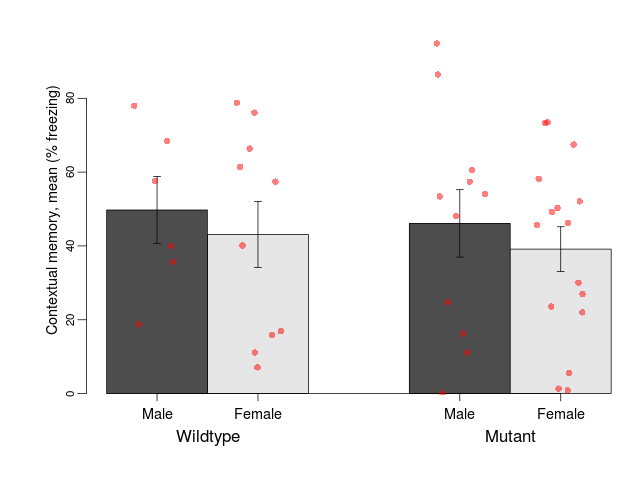

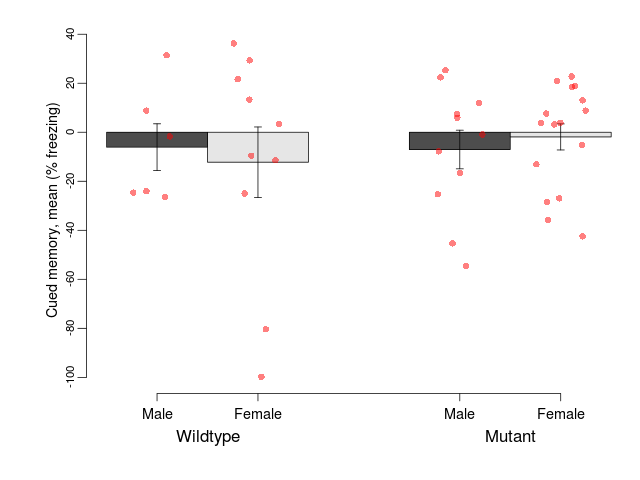
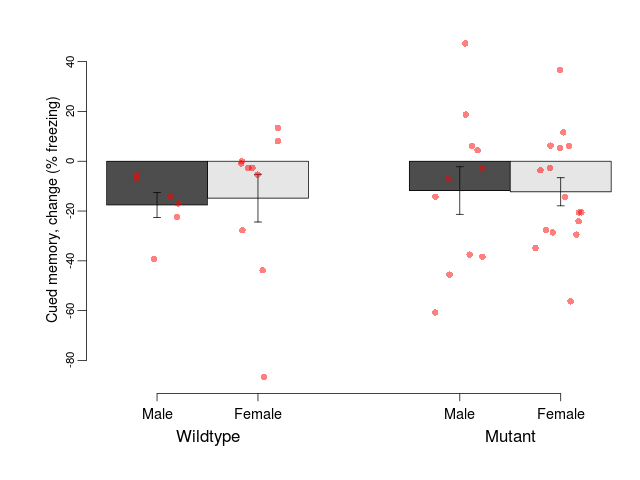
Variables shown are: Fear learning, trial effect, Fear learning, measured as extra % time freezing before third trial compared to % time freezing before first trial. Fear learning, tone effect, Fear learning, measured as increase in % time freezing due to third tone compared to increase in % time freezing due to first tone. Contextual memory, mean, Contextual memory, measured as difference in % time freezing during first 120 s re-exposure to the box compared to first 120 s in the box on previous day. Contextual memory, change, Contextual memory, measured as increase in % time spent freezing from first time bin of 30 s to fourth bin of 30 s during 120 s re-exposure to the box. Cued memory, mean, Cued memory, measured as increase in % time spent freezing during 120 s of tone re-exposure compared to increase in % time spent freezing during initial tone on previous day. Cued memory, change, Cued memory, measured as increase in % time spent freezing from first time bin of 30 s to fourth bin of 30 s during 120 s re-exposure to the tone.
| Variable | Units | Wildtype M (n=6) | Wildtype F (n=10) | Mutant M (n=11) | Mutant F (n=16) | P(sex×mutation) | P(mutation) |
|---|---|---|---|---|---|---|---|
| Fear learning, trial effect | % freezing | 29.9 (14.7) | 51.4 (10.9) | 38.2 (8.8) | 32.1 (8.4) | 0.21 | 0.41 |
| Fear learning, tone effect | % freezing | 14.1 (15.7) | -3 (15.3) | 9.3 (9.3) | 13.7 (7.2) | 0.36 | 0.46 |
| Contextual memory, mean | % freezing | 49.7 (9.1) | 43.1 (8.9) | 46.1 (9.1) | 39.1 (6) | 0.98 | 0.65 |
| Contextual memory, change | % freezing | 15.5 (14.9) | 12.9 (7.1) | 20.4 (6.6) | 12.6 (9.6) | 0.8 | 0.87 |
| Cued memory, mean | % freezing | -6.1 (9.5) | -12.2 (14.4) | -7 (7.9) | -1.9 (5.3) | 0.56 | 0.53 |
| Cued memory, change | % freezing | -17.6 (5) | -14.8 (9.6) | -11.8 (9.5) | -12.3 (5.6) | 0.85 | 0.65 |
Behaviour raw data
| Animals | View |
| Elevated Plus Maze | View |
| Open Field | View |
| Novel Object Exploration | View |
| Rotarod | View |