G2C::Genetics
Tanc1 knock-out mouse
S.G.N. Grant and the G2C Consortium
Corresponding email: Seth.Grant@ed.ac.uk
G2CMine Data Warehouse
| Tanc1 @ G2CMine |
Genetic and Genomic Information
| Gene symbol | Tanc1 |
| MGI ID | MGI:1914110 |
| G2Cdb mouse | G00003848 |
| Ensembl mouse | unknown |
| G2Cdb human | G00006838 |
| Ensembl human | unknown |
G2CMine Data Warehouse
G2CMine integrates the scientific findings of the Genes to Cognition Programme that utilised neuroproteomics, psychiatric genetics, high-throughput mouse gene targeting combined with behavioural and electrophysiological phenotyping and informatics in order to develop a general strategy for understanding cognition at the molecular, cellular and systems neuroscience levels.
G2CMine provides comprehensive Gene Ontology, Mammalian Phenotype Ontology, Human Phenotype Ontology, UniProt, genetic and protein interactions, and regional mouse brain expression results, together with the phenotyping results of the G2C Programme.
Mutation
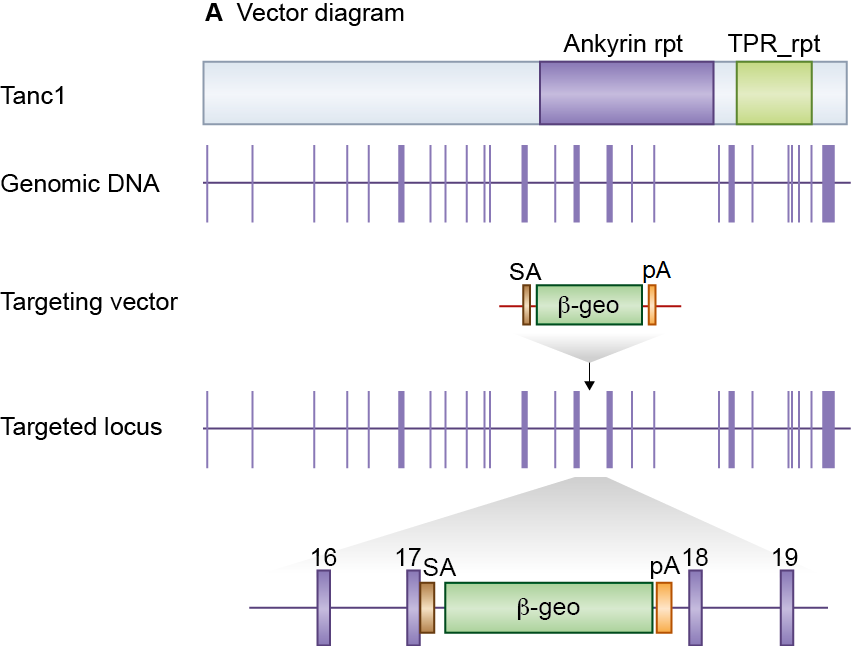
A mouse embryonic stem (ES) cell line (CE0101, strain 129/Ola) with an insertional mutation in Tanc1 was obtained from Sanger Institute Gene Trap Resource (SIGTR - sanger.ac.uk/PostGenomics/genetrap/). The insertional mutation in CE0101 by the gene-trapping vector, pGT1lxf, that was designed to create an in-frame fusion between the 5' exons of the trapped gene and a reporter, β-geo (a fusion of β-galactosidase and neomycin phosphotransferase II) occurred within exon 17. Thus, the gene-trapped locus is predicted to yield a fusion transcript containing exons 1-17 of Tanc1 and β-geo.
The ES cells were injected into C57BL/6 blastocysts to create chimeric mice, which were bred with 129S5 mice to generate heterozygous (+/-) Tanc1-mutant mice. Those F1 heterozygous mice had been backcrossed with 129S5 mice for 1-2 times before being used for intercrossing.
Location of Tanc1 gene trap mice Tanc1 is a 27 exon gene encoding the Tanc1 protein and contain ankyrin repeat and TPR repeat domains (top). The Tanc1 gene trap is located in exon 17.
Genotyping
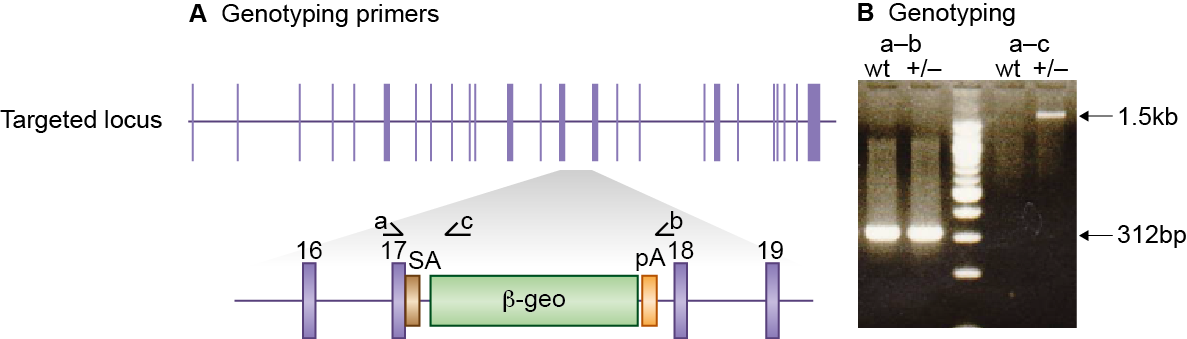
Genomic DNA was isolated from ES cells or mouse tissues by Wizard SV 96 Genomic DNA purification system (Promega Cat A2371). Genotyping PCR consisted of a 312bp product amplified from the wild-type (wt) allele using a forward primer A (5'- CATGAAGAAGTTGTCACTCTC -3') and a reverse primer B (5'- CAGTCAGACACTGAATCTTC -3'). A 1.5kb product was amplified from the targeted allele using primer A with reverse primer C (5'- CAGTCCTCTTCACATCCATG -3'), within the β-geo cassette. After enzymatic amplification for 35 cycles (45 seconds at 94 °C, 45 seconds at 55 °C, and 1 minute at 72 °C), the PCR products were size-fractionated on a 2% agarose gel in 1x Tris borate-EDTA buffer.
Primers used for genotyping (a,b&c) PCR genotyping of gene trap Tanc1 mice using a common forward primer, a, and reverse primers b and c to amplify the wt and mutant alleles respectively.
Expression

Total RNA (100μg) was isolated from ES cells with RNeasy Mini kit (Qiagen, Cat 74104). RT-PCR was performed by generating first strand cDNA using Oligo(dT)12-18 primer (Invitrogen, Cat 18418-012) and superscript II reverse transcriptase (Invitrogen, Cat 18064-071). RT-PCR to detect a loss of Tanc1 RNA consisted of a 551bp product amplified using a forward primer X (5'- CTGTGGATCGGTTACAGCAC -3') upstream of the insertion site and reverse primer Y (5'- GTTGACTTCGATTTCATGTTC-3') located downstream of the insertion site. After enzymatic amplification for 35 cycles (45 seconds at 94 °C, 1 minute at 55 °C, and 1 minute at 72 °C), the PCR products were size-fractionated on a 2% agarose gel in 1x Tris borate-EDTA buffer.
Primers used for RT-PCR (x&y) RT-PCR to detect loss of RNA - forward primer, X (in exon 16) and reverse primer Y (in exon 19). Amplification is weaker in heterozygous mice where the gene trap cassette has been inserted.
Breeding
Birth of Tanc1mutant mice followed non-Mendelian ratios with no offspring being homozygous knockouts. Genotypes of 3-week-old pups from Tanc1+/- intercrosses identified 11 wt, 20 Tanc1+/- and 0 Tanc1-/- progeny (Χ2 p= 0.0055). Male and female Tanc1+/- mice showed no gross abnormalities. Tanc1 mice were maintained by backcrossing onto the C57BL/6J background.
- Overview
- Basal Synaptic Transmission
- Paired Pulse Facilitation
- Theta Burst Stimulation
- Long Term Potentiation
Overview
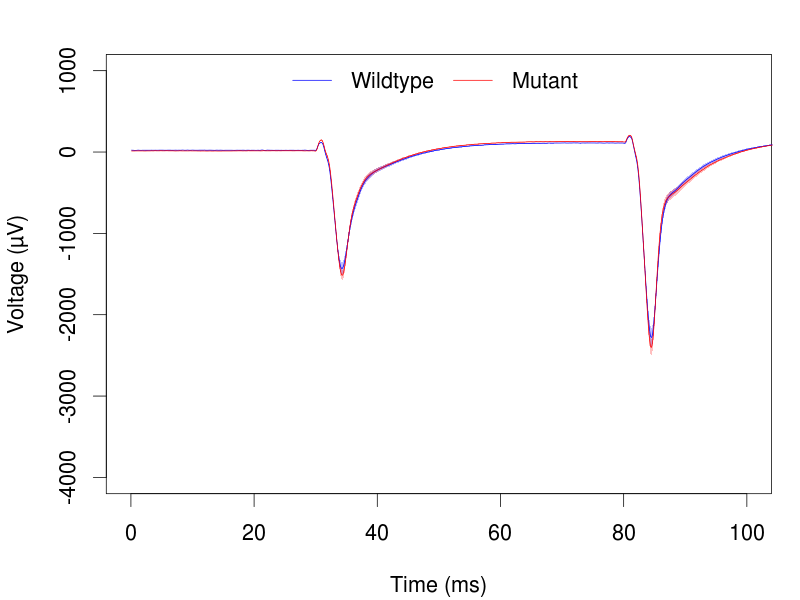
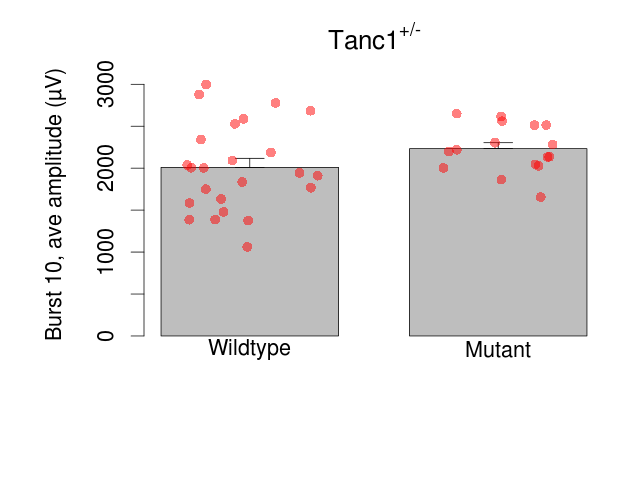
Mutant slices showed little overall electrophysiological difference from wildtype slices. With heterozygous genotype and no electrophysiological variables significantly affected in mutant slices, this mutation was deemed haplosufficient. Note that in the theta burst analysis, the tenth burst is analysed as representative of individual burst amplitude.

Variables shown are: Max fEPSP amplitude, Maximum field excitatory postsynaptic potential (fEPSP) amplitude. PPF at 50ms, ampl ratio, Paired pulse facilitation (PPF), pulses separated by 50ms, amplitude ratio. Burst 1, PPF at 10ms, ampl ratio, Paired pulse facilitation (PPF), pulses separated by 10ms, amplitude ratio, observed during first two pulses of the first 100Hz burst during theta-burst stimulation. Burst 1, EPSP3 depr, ampl ratio, Depression observed in third fEPSP relative to the second fEPSP of the first 100Hz burst, amplitude ratio. Burst 1, ave amplitude, Average amplitude of four fEPSPs in first burst. Burst 2, ave amplitude, Average amplitude of four fEPSPs in second burst. Burst 3, ave amplitude, Average amplitude of four fEPSPs in third burst. Burst 4, ave amplitude, Average amplitude of four fEPSPs in fourth burst. Burst 5, ave amplitude, Average amplitude of four fEPSPs in fifth burst. Burst 6, ave amplitude, Average amplitude of four fEPSPs in sixth burst. Burst 7, ave amplitude, Average amplitude of four fEPSPs in seventh burst. Burst 8, ave amplitude, Average amplitude of four fEPSPs in eighth burst. Burst 9, ave amplitude, Average amplitude of four fEPSPs in ninth burst. Burst 10, ave amplitude, Average amplitude of four fEPSPs in tenth burst. Burst 2-4 ave amplitude vs Burst 1, Facilitation observed in average amplitude of bursts 2-4, relative to average amplitude of burst 1. Burst 8-10 ave amplitude vs Burst 2-4, Depression observed in average amplitude of bursts 8-10, relative to average amplitude of bursts 2-4. LTP vs PTP, amplitude ratio, Reduction in potentiation from immediately after theta-burst stimulation to one hour later, fEPSP amplitude ratio. LTP based on amplitude, Long term potentiation, ratio of amplitudes of fEPSPs in test pathway and control pathway.
| Variable | Units | Wildtype slices (animals) | Wildtype mean (SEM) | Mutant slices (animals) | Mutant mean (SEM) | P(animals) | P(mutation) |
|---|---|---|---|---|---|---|---|
| Max fEPSP amplitude | µV | 24 (7) | 2840 (170) | 16 (5) | 3070 (150) | 0.22 | 0.44 |
| PPF at 50ms, ampl ratio | % | 24 (7) | 169.1 (2.9) | 16 (5) | 168.9 (4.2) | 0.069 | 0.97 |
| Burst 1, PPF at 10ms, ampl ratio | % | 24 (7) | 155.9 (4.7) | 16 (5) | 143.3 (6.7) | 0.023 * | 0.28 |
| Burst 1, EPSP3 depr, ampl ratio | % | 24 (7) | 66.3 (1.7) | 16 (5) | 66.2 (2.2) | 0.2 | 0.98 |
| Burst 1, ave amplitude | µV | 24 (7) | 1326 (67) | 16 (5) | 1505 (54) | 0.12 | 0.15 |
| Burst 2, ave amplitude | µV | 24 (7) | 2143 (110) | 16 (5) | 2420 (89) | 0.12 | 0.17 |
| Burst 3, ave amplitude | µV | 24 (7) | 2328 (119) | 16 (5) | 2616 (98) | 0.22 | 0.17 |
| Burst 4, ave amplitude | µV | 24 (7) | 2354 (123) | 16 (5) | 2599 (98) | 0.3 | 0.22 |
| Burst 5, ave amplitude | µV | 24 (7) | 2304 (116) | 16 (5) | 2536 (92) | 0.4 | 0.2 |
| Burst 6, ave amplitude | µV | 24 (7) | 2241 (115) | 16 (5) | 2459 (84) | 0.37 | 0.22 |
| Burst 7, ave amplitude | µV | 24 (7) | 2171 (110) | 16 (5) | 2382 (77) | 0.46 | 0.19 |
| Burst 8, ave amplitude | µV | 24 (7) | 2111 (108) | 16 (5) | 2323 (74) | 0.42 | 0.19 |
| Burst 9, ave amplitude | µV | 24 (7) | 2055 (107) | 16 (5) | 2275 (72) | 0.43 | 0.17 |
| Burst 10, ave amplitude | µV | 24 (7) | 2010 (108) | 16 (5) | 2233 (71) | 0.43 | 0.17 |
| Burst 2-4 ave amplitude vs Burst 1 | % | 24 (7) | 172 (3.2) | 16 (5) | 171.9 (5.2) | 0.24 | 0.99 |
| Burst 8-10 ave amplitude vs Burst 2-4 | % | 24 (7) | 90.6 (1.1) | 16 (5) | 90.1 (0.9) | 0.25 | 0.78 |
| LTP vs PTP, amplitude ratio | % | 24 (7) | 81.9 (1.1) | 16 (5) | 86 (1.5) | 0.22 | 0.075 |
| LTP based on amplitude | % | 24 (7) | 165.7 (3.7) | 16 (5) | 167.1 (4.3) | 0.21 | 0.85 |
Basal Synaptic Transmission
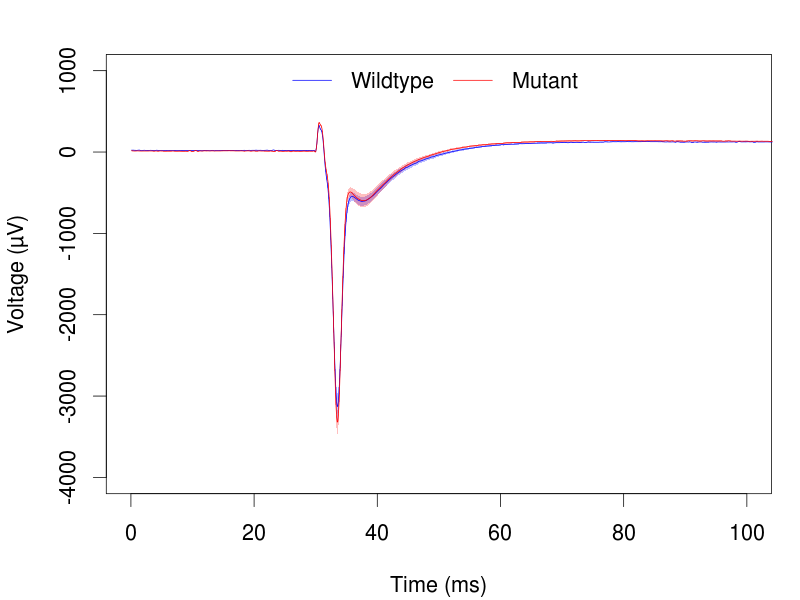
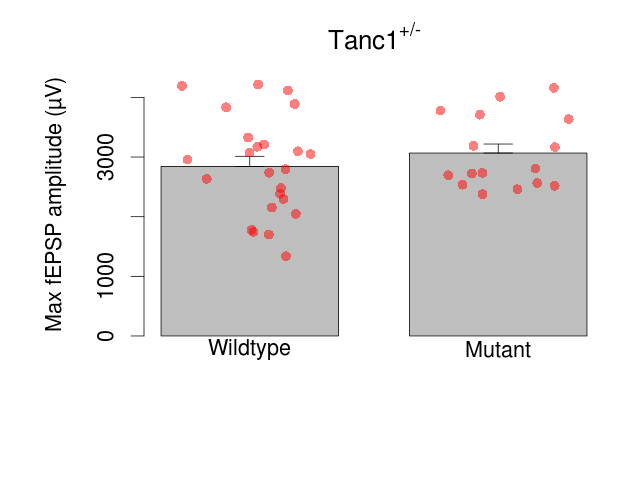
Variables shown are: Max fEPSP amplitude, Maximum field excitatory postsynaptic potential (fEPSP) amplitude.
| Variable | Units | Wildtype slices (animals) | Wildtype mean (SEM) | Mutant slices (animals) | Mutant mean (SEM) | P(animals) | P(mutation) |
|---|---|---|---|---|---|---|---|
| Max fEPSP amplitude | µV | 24 (7) | 2840 (170) | 16 (5) | 3070 (150) | 0.22 | 0.44 |
Paired Pulse Facilitation
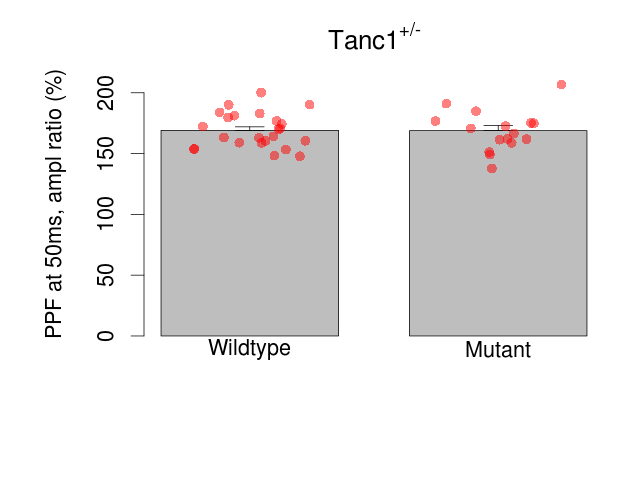
Variables shown are: PPF at 50ms, ampl ratio, Paired pulse facilitation (PPF), pulses separated by 50ms, amplitude ratio.
| Variable | Units | Wildtype slices (animals) | Wildtype mean (SEM) | Mutant slices (animals) | Mutant mean (SEM) | P(animals) | P(mutation) |
|---|---|---|---|---|---|---|---|
| PPF at 50ms, ampl ratio | % | 24 (7) | 169.1 (2.9) | 16 (5) | 168.9 (4.2) | 0.069 | 0.97 |
Theta Burst Stimulation
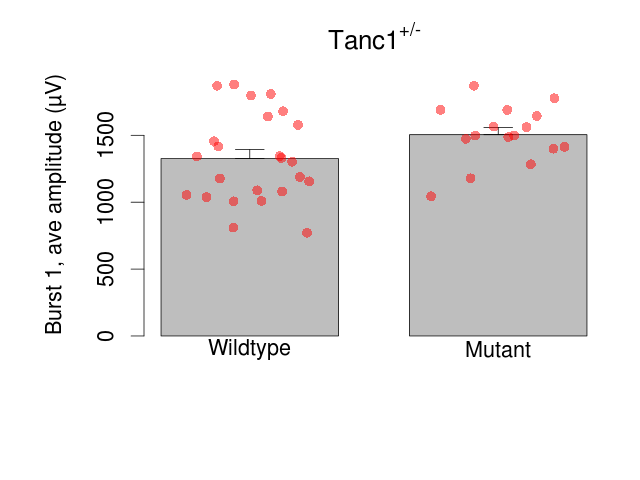
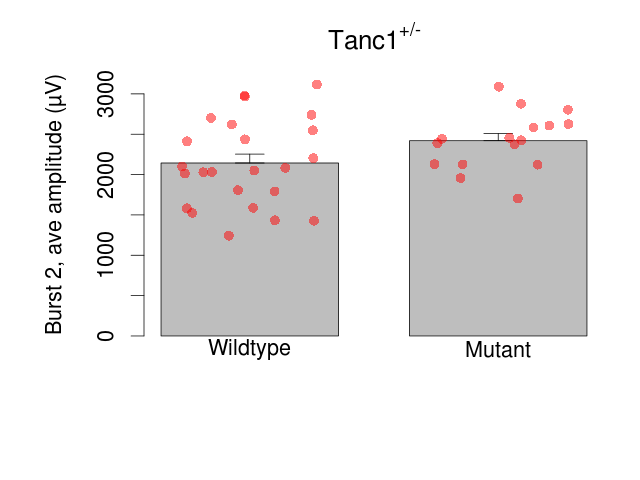

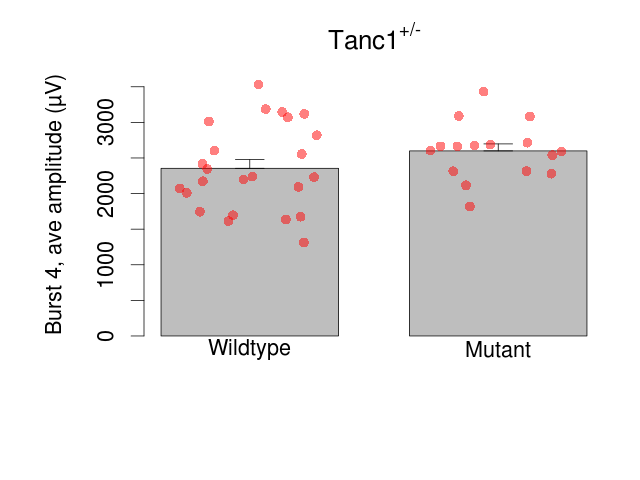
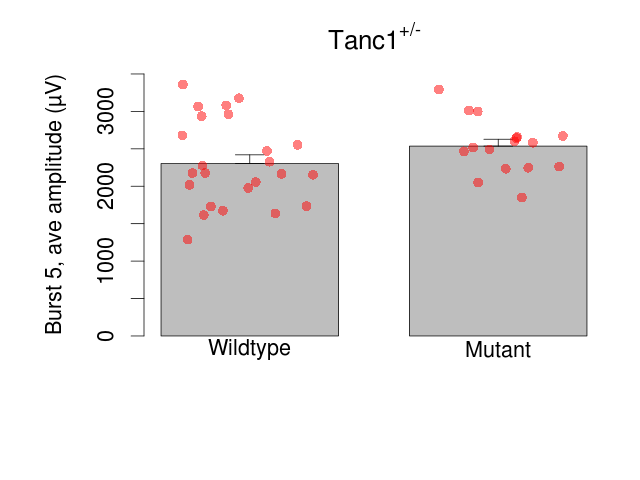
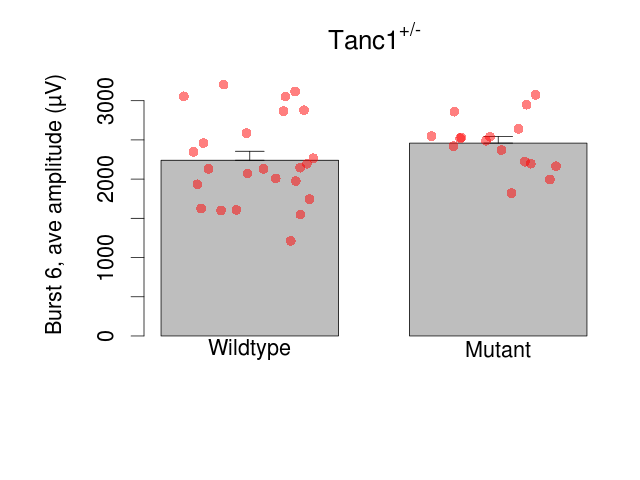

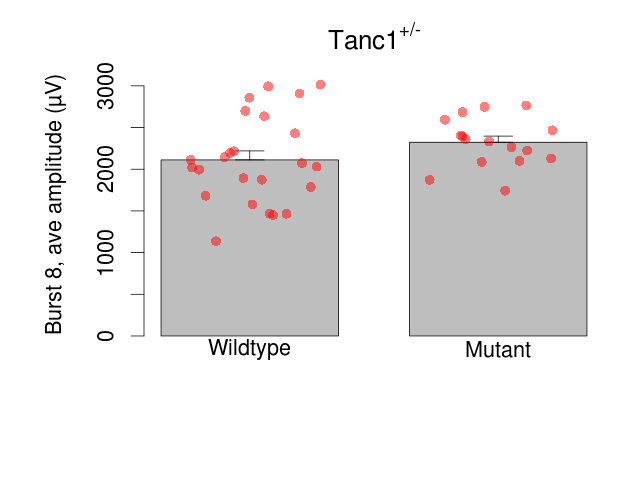

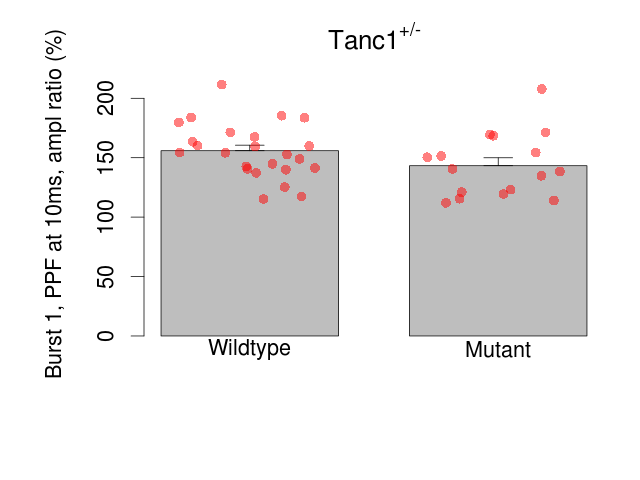

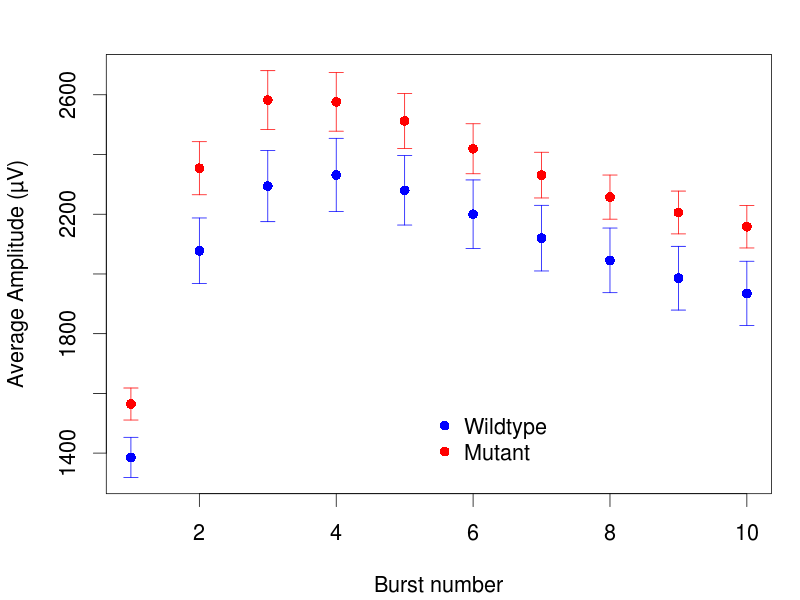

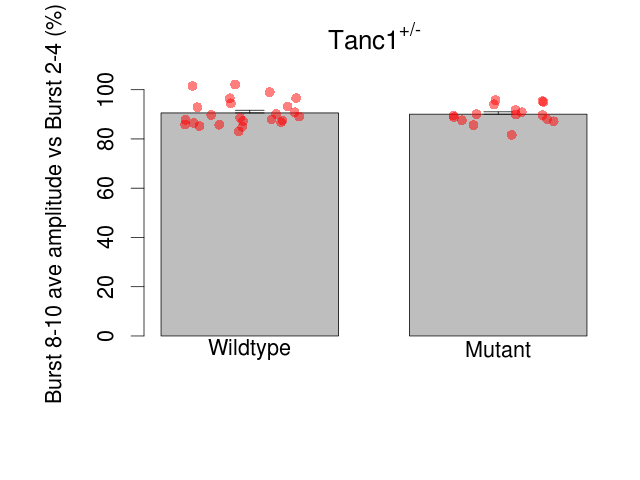
Variables shown are: Burst 1, PPF at 10ms, ampl ratio, Paired pulse facilitation (PPF), pulses separated by 10ms, amplitude ratio, observed during first two pulses of the first 100Hz burst during theta-burst stimulation. Burst 1, EPSP3 depr, ampl ratio, Depression observed in third fEPSP relative to the second fEPSP of the first 100Hz burst, amplitude ratio. Burst 1, ave amplitude, Average amplitude of four fEPSPs in first burst. Burst 2, ave amplitude, Average amplitude of four fEPSPs in second burst. Burst 3, ave amplitude, Average amplitude of four fEPSPs in third burst. Burst 4, ave amplitude, Average amplitude of four fEPSPs in fourth burst. Burst 5, ave amplitude, Average amplitude of four fEPSPs in fifth burst. Burst 6, ave amplitude, Average amplitude of four fEPSPs in sixth burst. Burst 7, ave amplitude, Average amplitude of four fEPSPs in seventh burst. Burst 8, ave amplitude, Average amplitude of four fEPSPs in eighth burst. Burst 9, ave amplitude, Average amplitude of four fEPSPs in ninth burst. Burst 10, ave amplitude, Average amplitude of four fEPSPs in tenth burst. Burst 2-4 ave amplitude vs Burst 1, Facilitation observed in average amplitude of bursts 2-4, relative to average amplitude of burst 1. Burst 8-10 ave amplitude vs Burst 2-4, Depression observed in average amplitude of bursts 8-10, relative to average amplitude of bursts 2-4.
| Variable | Units | Wildtype slices (animals) | Wildtype mean (SEM) | Mutant slices (animals) | Mutant mean (SEM) | P(animals) | P(mutation) |
|---|---|---|---|---|---|---|---|
| Burst 1, PPF at 10ms, ampl ratio | % | 24 (7) | 155.9 (4.7) | 16 (5) | 143.3 (6.7) | 0.023 * | 0.28 |
| Burst 1, EPSP3 depr, ampl ratio | % | 24 (7) | 66.3 (1.7) | 16 (5) | 66.2 (2.2) | 0.2 | 0.98 |
| Burst 1, ave amplitude | µV | 24 (7) | 1326 (67) | 16 (5) | 1505 (54) | 0.12 | 0.15 |
| Burst 2, ave amplitude | µV | 24 (7) | 2143 (110) | 16 (5) | 2420 (89) | 0.12 | 0.17 |
| Burst 3, ave amplitude | µV | 24 (7) | 2328 (119) | 16 (5) | 2616 (98) | 0.22 | 0.17 |
| Burst 4, ave amplitude | µV | 24 (7) | 2354 (123) | 16 (5) | 2599 (98) | 0.3 | 0.22 |
| Burst 5, ave amplitude | µV | 24 (7) | 2304 (116) | 16 (5) | 2536 (92) | 0.4 | 0.2 |
| Burst 6, ave amplitude | µV | 24 (7) | 2241 (115) | 16 (5) | 2459 (84) | 0.37 | 0.22 |
| Burst 7, ave amplitude | µV | 24 (7) | 2171 (110) | 16 (5) | 2382 (77) | 0.46 | 0.19 |
| Burst 8, ave amplitude | µV | 24 (7) | 2111 (108) | 16 (5) | 2323 (74) | 0.42 | 0.19 |
| Burst 9, ave amplitude | µV | 24 (7) | 2055 (107) | 16 (5) | 2275 (72) | 0.43 | 0.17 |
| Burst 10, ave amplitude | µV | 24 (7) | 2010 (108) | 16 (5) | 2233 (71) | 0.43 | 0.17 |
| Burst 2-4 ave amplitude vs Burst 1 | % | 24 (7) | 172 (3.2) | 16 (5) | 171.9 (5.2) | 0.24 | 0.99 |
| Burst 8-10 ave amplitude vs Burst 2-4 | % | 24 (7) | 90.6 (1.1) | 16 (5) | 90.1 (0.9) | 0.25 | 0.78 |
Long Term Potentiation
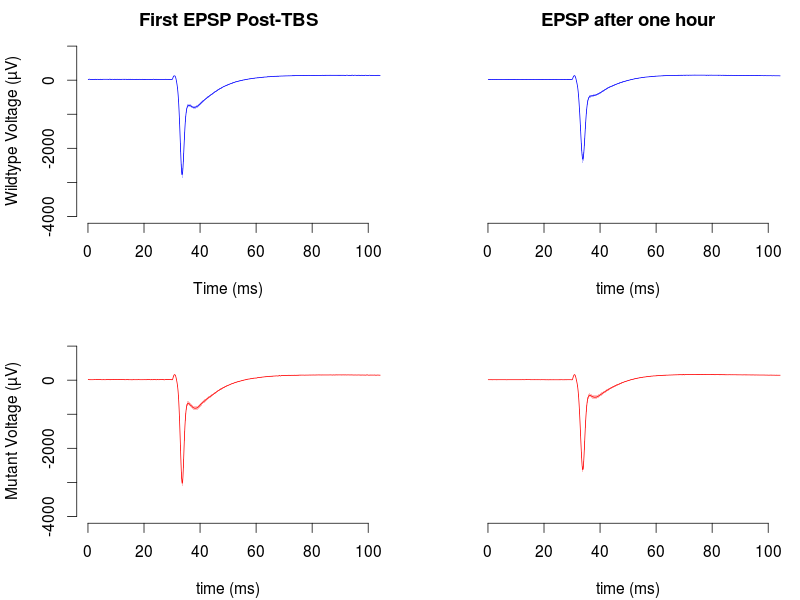
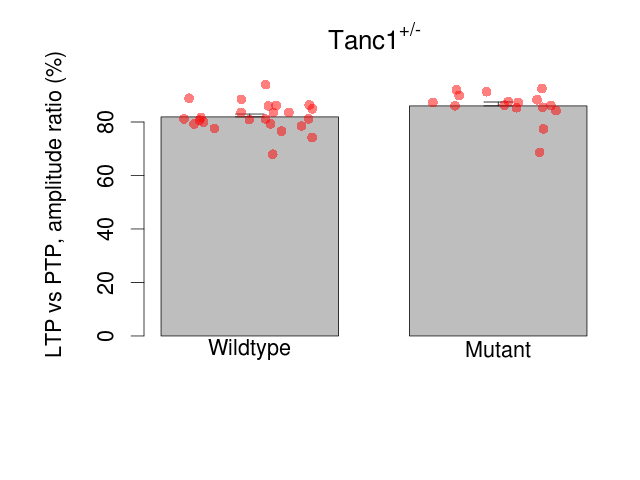

Variables shown are: LTP vs PTP, amplitude ratio, Reduction in potentiation from immediately after theta-burst stimulation to one hour later, fEPSP amplitude ratio. LTP based on amplitude, Long term potentiation, ratio of amplitudes of fEPSPs in test pathway and control pathway.
| Variable | Units | Wildtype slices (animals) | Wildtype mean (SEM) | Mutant slices (animals) | Mutant mean (SEM) | P(animals) | P(mutation) |
|---|---|---|---|---|---|---|---|
| LTP vs PTP, amplitude ratio | % | 24 (7) | 81.9 (1.1) | 16 (5) | 86 (1.5) | 0.22 | 0.075 |
| LTP based on amplitude | % | 24 (7) | 165.7 (3.7) | 16 (5) | 167.1 (4.3) | 0.21 | 0.85 |
Hippocampal slice electrophysiology raw data
| Animals and Brain slices | View |
| Field EPSP (Maximum) | View |
| Paired Pulse Facilitation | View |
| Long Term Potentiation | View |
| Data Files | View |