G2C::Genetics
beta-Pix knock-out mouse
S.G.N. Grant and the G2C Consortium
Corresponding email: Seth.Grant@ed.ac.uk
G2CMine Data Warehouse
| Arhgef7 @ G2CMine |
Genetic and Genomic Information
| Gene symbol | Arhgef7 |
| MGI ID | MGI:1860493 |
| G2Cdb mouse | G00000894 |
| Ensembl mouse | ENSMUSG00000031511 |
| G2Cdb human | G00002143 |
| Ensembl human | ENSG00000102606 |
G2CMine Data Warehouse
G2CMine integrates the scientific findings of the Genes to Cognition Programme that utilised neuroproteomics, psychiatric genetics, high-throughput mouse gene targeting combined with behavioural and electrophysiological phenotyping and informatics in order to develop a general strategy for understanding cognition at the molecular, cellular and systems neuroscience levels.
G2CMine provides comprehensive Gene Ontology, Mammalian Phenotype Ontology, Human Phenotype Ontology, UniProt, genetic and protein interactions, and regional mouse brain expression results, together with the phenotyping results of the G2C Programme.
Mutation
Generation of Arhgef7 mutant mice described in Omelchenko et al (2014)
Genotyping
Arhgef7 genotyping described in Omelchenko et al (2014)
Expression
Arhgef7 expression described in Omelchenko et al (2014)
Breeding
beta-Pix-/- mice were known to be lethal so beta-Pix+/- mice were produced for phenotypic analysis. Male and female beta-Pix+/- mice developed normally to adulthood, were fertile, exhibited normal body size and no gross abnormalities. Birth of beta-Pix+/- mice followed Mendelian ratios with 49% of offspring being homozygous knockouts. Genotypes of 3-week-old-pups from beta-Pix+/- back-crosses identified 98 wildtype and 94 beta-Pix+/- progeny (Χ2 p= 0.77). Backcrosses onto the C57BL/6J background were used to maintain the colony and generate mice to study.
- Overview
- Basal Synaptic Transmission
- Paired Pulse Facilitation
- Theta Burst Stimulation
- Long Term Potentiation
Overview
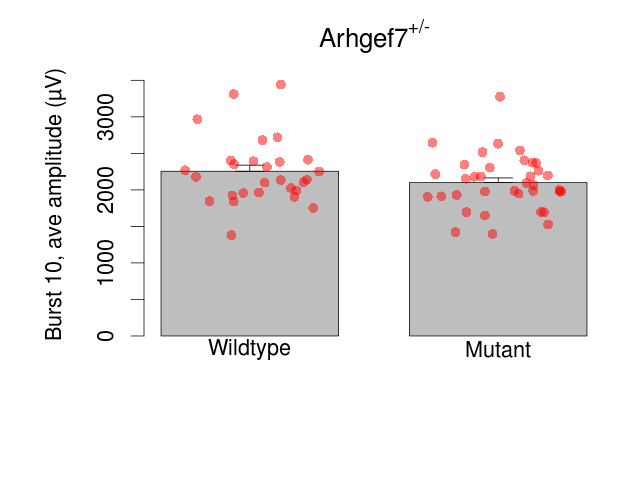
Mutant slices showed little overall electrophysiological difference from wildtype slices. With heterozygous genotype and no electrophysiological variables significantly affected in mutant slices, this mutation was deemed haplosufficient. Note that in the theta burst analysis, the tenth burst is analysed as representative of individual burst amplitude.
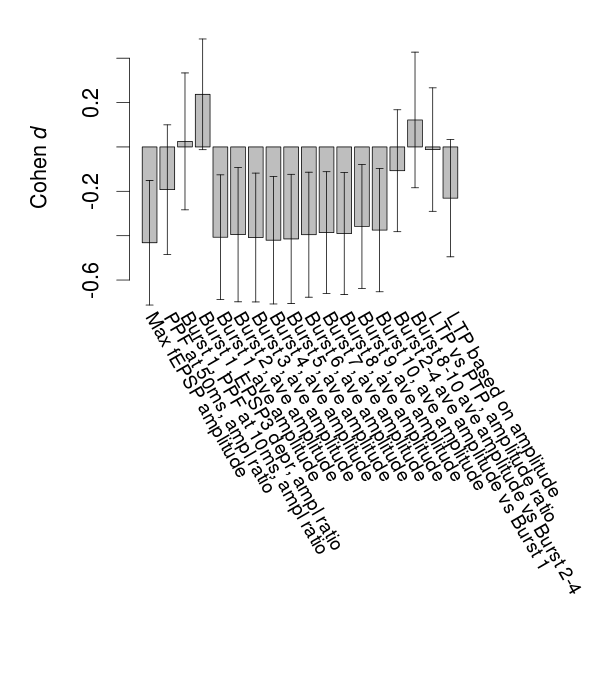
Variables shown are: Max fEPSP amplitude, Maximum field excitatory postsynaptic potential (fEPSP) amplitude. PPF at 50ms, ampl ratio, Paired pulse facilitation (PPF), pulses separated by 50ms, amplitude ratio. Burst 1, PPF at 10ms, ampl ratio, Paired pulse facilitation (PPF), pulses separated by 10ms, amplitude ratio, observed during first two pulses of the first 100Hz burst during theta-burst stimulation. Burst 1, EPSP3 depr, ampl ratio, Depression observed in third fEPSP relative to the second fEPSP of the first 100Hz burst, amplitude ratio. Burst 1, ave amplitude, Average amplitude of four fEPSPs in first burst. Burst 2, ave amplitude, Average amplitude of four fEPSPs in second burst. Burst 3, ave amplitude, Average amplitude of four fEPSPs in third burst. Burst 4, ave amplitude, Average amplitude of four fEPSPs in fourth burst. Burst 5, ave amplitude, Average amplitude of four fEPSPs in fifth burst. Burst 6, ave amplitude, Average amplitude of four fEPSPs in sixth burst. Burst 7, ave amplitude, Average amplitude of four fEPSPs in seventh burst. Burst 8, ave amplitude, Average amplitude of four fEPSPs in eighth burst. Burst 9, ave amplitude, Average amplitude of four fEPSPs in ninth burst. Burst 10, ave amplitude, Average amplitude of four fEPSPs in tenth burst. Burst 2-4 ave amplitude vs Burst 1, Facilitation observed in average amplitude of bursts 2-4, relative to average amplitude of burst 1. Burst 8-10 ave amplitude vs Burst 2-4, Depression observed in average amplitude of bursts 8-10, relative to average amplitude of bursts 2-4. LTP vs PTP, amplitude ratio, Reduction in potentiation from immediately after theta-burst stimulation to one hour later, fEPSP amplitude ratio. LTP based on amplitude, Long term potentiation, ratio of amplitudes of fEPSPs in test pathway and control pathway.
| Variable | Units | Wildtype slices (animals) | Wildtype mean (SEM) | Mutant slices (animals) | Mutant mean (SEM) | P(animals) | P(mutation) |
|---|---|---|---|---|---|---|---|
| Max fEPSP amplitude | µV | 29 (10) | 3578 (149) | 36 (11) | 3292 (88) | 0.76 | 0.069 |
| PPF at 50ms, ampl ratio | % | 29 (10) | 176.3 (2.9) | 36 (11) | 173.2 (2.7) | 0.032 * | 0.55 |
| Burst 1, PPF at 10ms, ampl ratio | % | 28 (10) | 178 (4.5) | 36 (11) | 178.6 (3.8) | 1.3e-05 *** | 0.95 |
| Burst 1, EPSP3 depr, ampl ratio | % | 28 (10) | 63.4 (1.9) | 36 (11) | 65.9 (1.8) | 0.0072 ** | 0.49 |
| Burst 1, ave amplitude | µV | 28 (10) | 1473 (61) | 36 (11) | 1365 (35) | 0.39 | 0.14 |
| Burst 2, ave amplitude | µV | 28 (10) | 2365 (114) | 36 (11) | 2166 (69) | 0.39 | 0.15 |
| Burst 3, ave amplitude | µV | 28 (10) | 2618 (115) | 36 (11) | 2409 (70) | 0.4 | 0.13 |
| Burst 4, ave amplitude | µV | 28 (10) | 2661 (105) | 36 (11) | 2460 (68) | 0.47 | 0.11 |
| Burst 5, ave amplitude | µV | 28 (10) | 2602 (97) | 36 (11) | 2418 (64) | 0.51 | 0.11 |
| Burst 6, ave amplitude | µV | 28 (10) | 2514 (89) | 36 (11) | 2349 (62) | 0.56 | 0.12 |
| Burst 7, ave amplitude | µV | 28 (10) | 2428 (89) | 36 (11) | 2269 (60) | 0.51 | 0.14 |
| Burst 8, ave amplitude | µV | 28 (10) | 2365 (85) | 36 (11) | 2206 (62) | 0.5 | 0.14 |
| Burst 9, ave amplitude | µV | 28 (10) | 2288 (82) | 36 (11) | 2145 (62) | 0.48 | 0.17 |
| Burst 10, ave amplitude | µV | 28 (10) | 2255 (85) | 36 (11) | 2101 (63) | 0.37 | 0.17 |
| Burst 2-4 ave amplitude vs Burst 1 | % | 28 (10) | 173.5 (3.9) | 36 (11) | 171.5 (3) | 0.024 * | 0.74 |
| Burst 8-10 ave amplitude vs Burst 2-4 | % | 28 (10) | 90.6 (1.2) | 36 (11) | 91.3 (0.8) | 0.11 | 0.69 |
| LTP vs PTP, amplitude ratio | % | 28 (10) | 79.5 (1.3) | 36 (11) | 79.4 (0.9) | 0.0099 ** | 0.97 |
| LTP based on amplitude | % | 28 (10) | 178.4 (3.5) | 36 (11) | 174.3 (2.9) | 0.16 | 0.43 |
Basal Synaptic Transmission
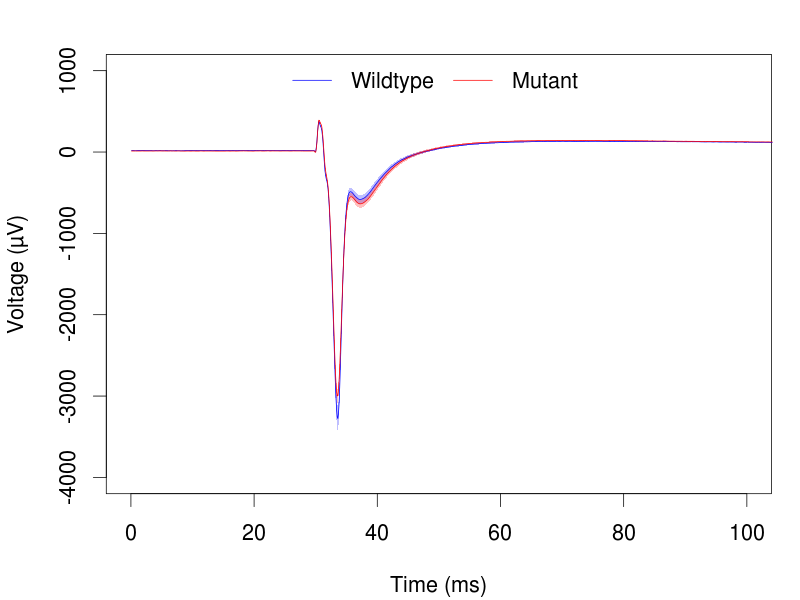
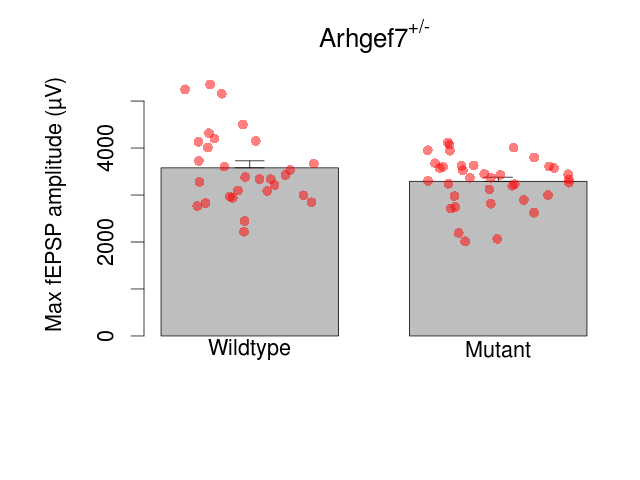
Variables shown are: Max fEPSP amplitude, Maximum field excitatory postsynaptic potential (fEPSP) amplitude.
| Variable | Units | Wildtype slices (animals) | Wildtype mean (SEM) | Mutant slices (animals) | Mutant mean (SEM) | P(animals) | P(mutation) |
|---|---|---|---|---|---|---|---|
| Max fEPSP amplitude | µV | 29 (10) | 3578 (149) | 36 (11) | 3292 (88) | 0.76 | 0.069 |
Paired Pulse Facilitation
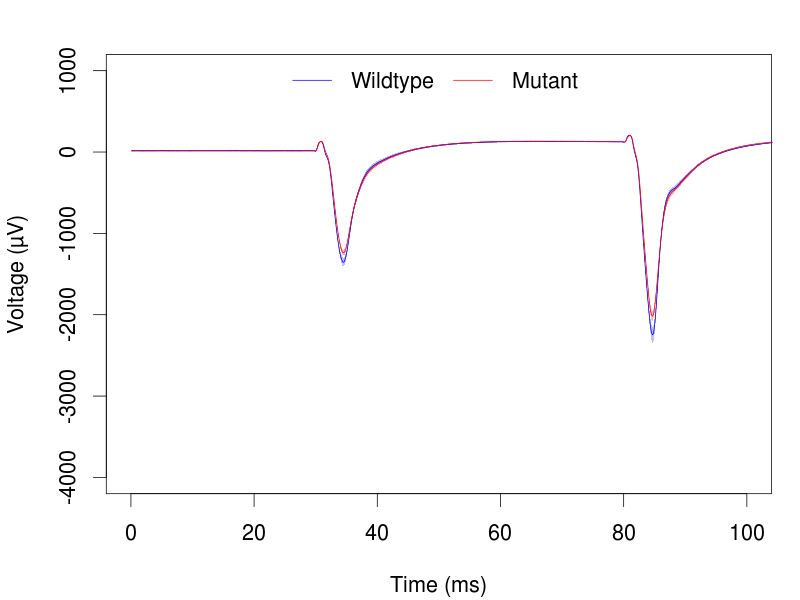
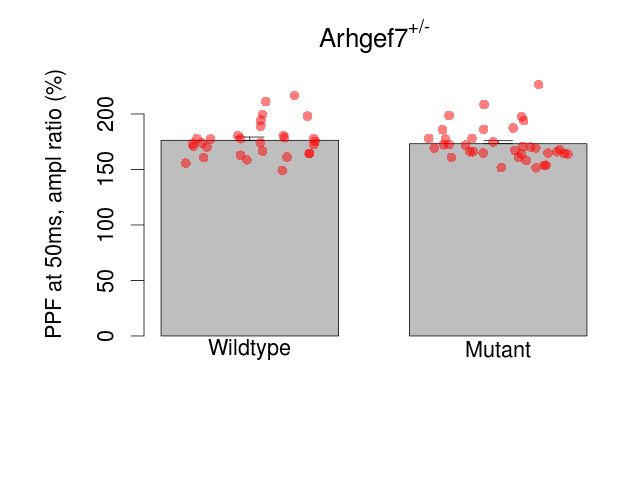
Variables shown are: PPF at 50ms, ampl ratio, Paired pulse facilitation (PPF), pulses separated by 50ms, amplitude ratio.
| Variable | Units | Wildtype slices (animals) | Wildtype mean (SEM) | Mutant slices (animals) | Mutant mean (SEM) | P(animals) | P(mutation) |
|---|---|---|---|---|---|---|---|
| PPF at 50ms, ampl ratio | % | 29 (10) | 176.3 (2.9) | 36 (11) | 173.2 (2.7) | 0.032 * | 0.55 |
Theta Burst Stimulation
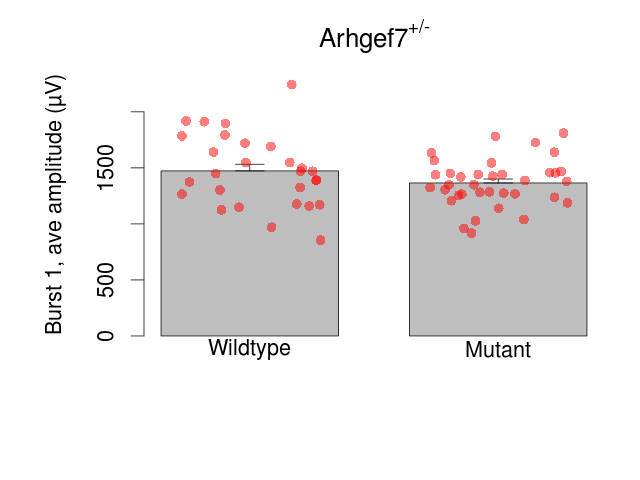
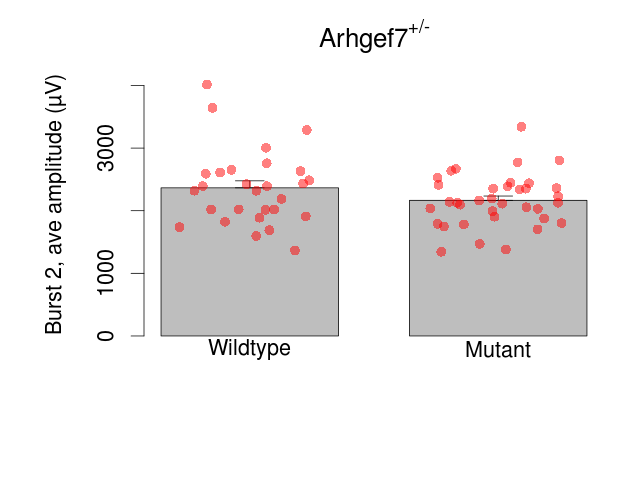
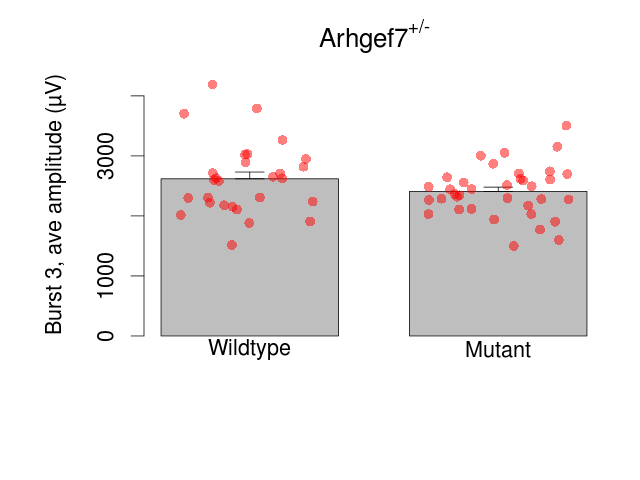
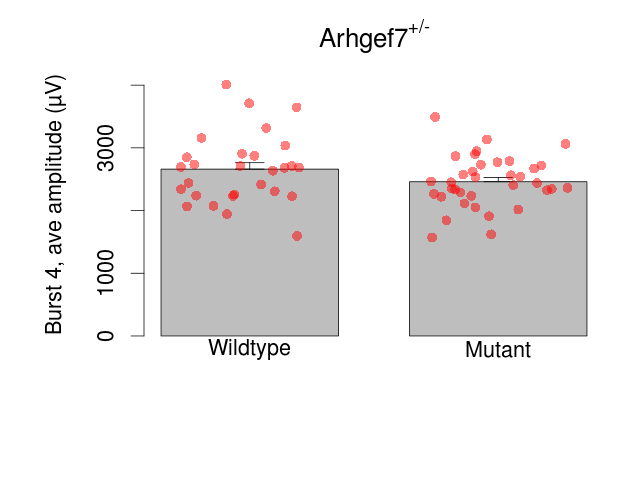
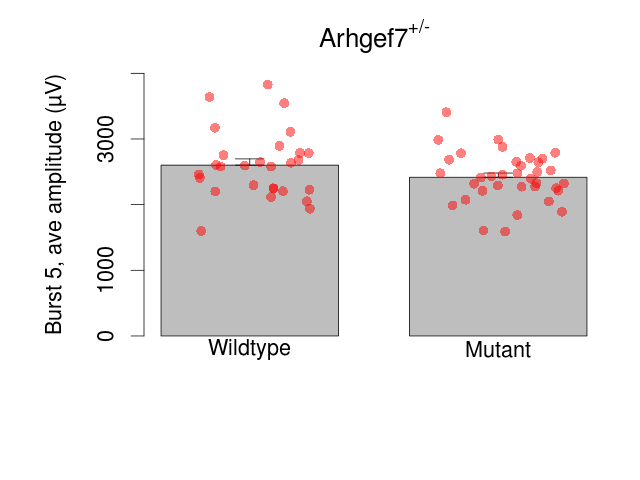
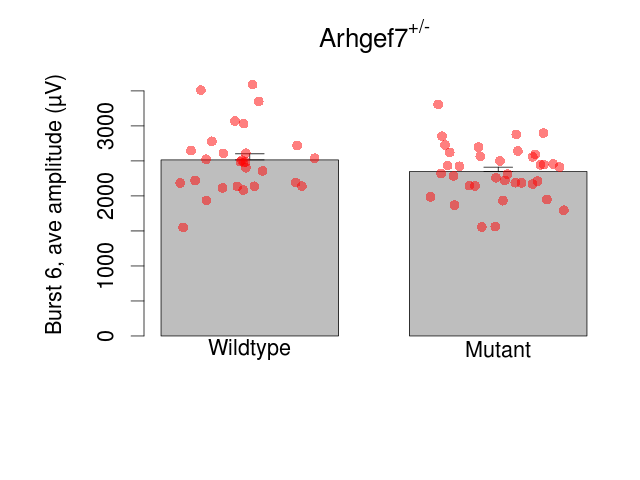
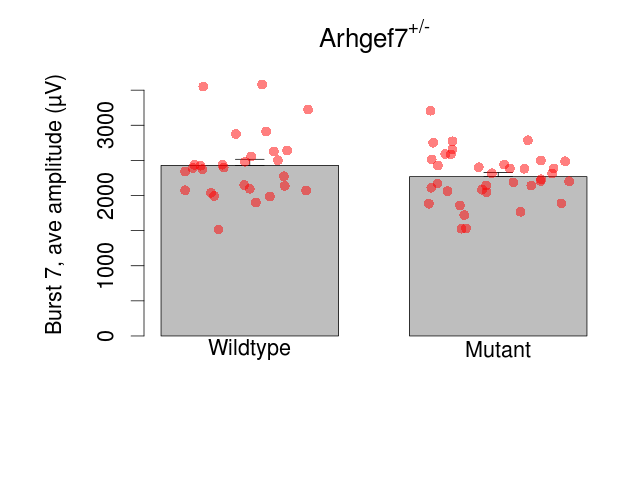
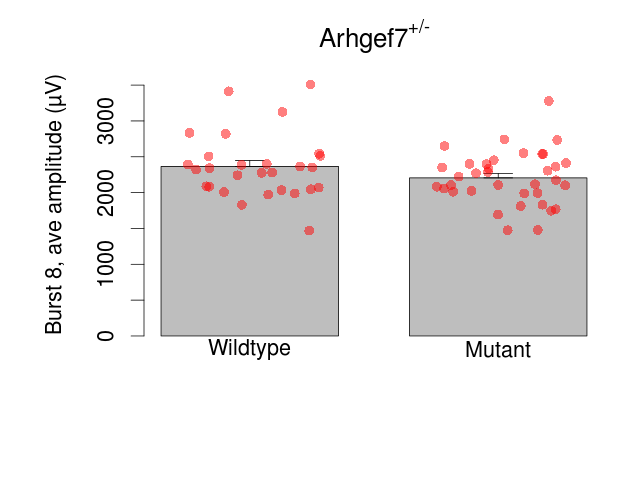
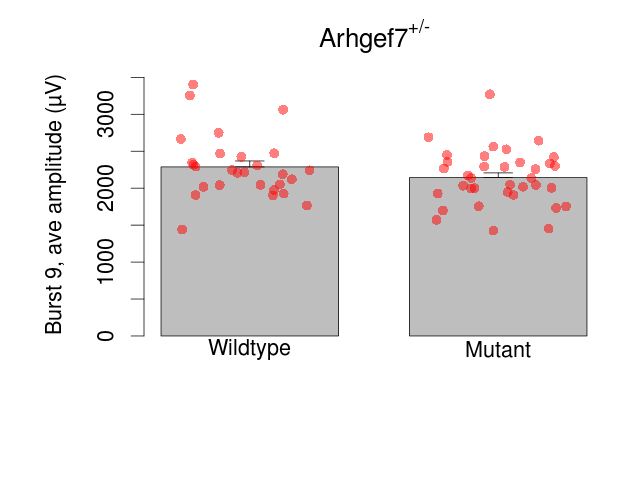


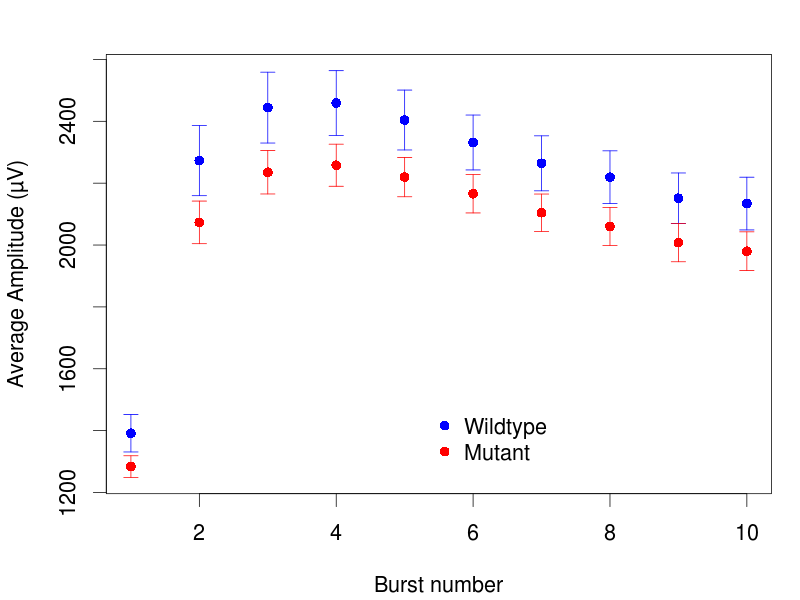
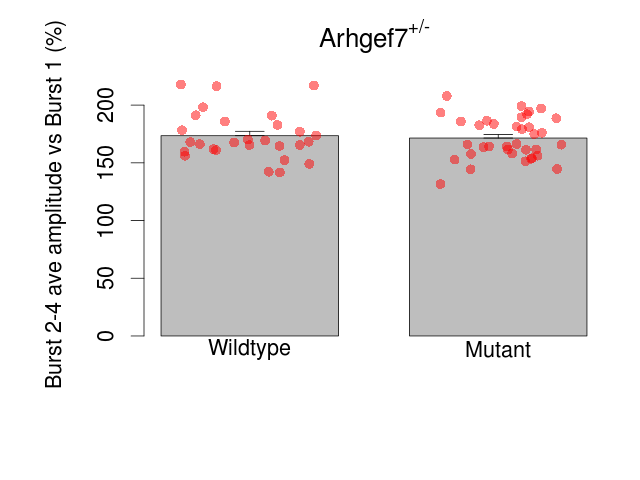
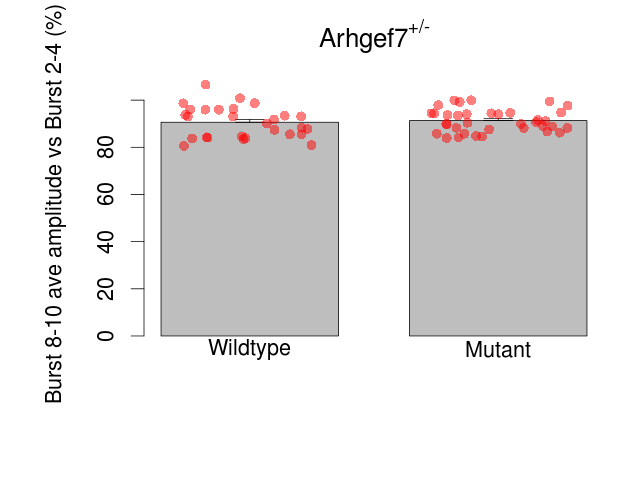
Variables shown are: Burst 1, PPF at 10ms, ampl ratio, Paired pulse facilitation (PPF), pulses separated by 10ms, amplitude ratio, observed during first two pulses of the first 100Hz burst during theta-burst stimulation. Burst 1, EPSP3 depr, ampl ratio, Depression observed in third fEPSP relative to the second fEPSP of the first 100Hz burst, amplitude ratio. Burst 1, ave amplitude, Average amplitude of four fEPSPs in first burst. Burst 2, ave amplitude, Average amplitude of four fEPSPs in second burst. Burst 3, ave amplitude, Average amplitude of four fEPSPs in third burst. Burst 4, ave amplitude, Average amplitude of four fEPSPs in fourth burst. Burst 5, ave amplitude, Average amplitude of four fEPSPs in fifth burst. Burst 6, ave amplitude, Average amplitude of four fEPSPs in sixth burst. Burst 7, ave amplitude, Average amplitude of four fEPSPs in seventh burst. Burst 8, ave amplitude, Average amplitude of four fEPSPs in eighth burst. Burst 9, ave amplitude, Average amplitude of four fEPSPs in ninth burst. Burst 10, ave amplitude, Average amplitude of four fEPSPs in tenth burst. Burst 2-4 ave amplitude vs Burst 1, Facilitation observed in average amplitude of bursts 2-4, relative to average amplitude of burst 1. Burst 8-10 ave amplitude vs Burst 2-4, Depression observed in average amplitude of bursts 8-10, relative to average amplitude of bursts 2-4.
| Variable | Units | Wildtype slices (animals) | Wildtype mean (SEM) | Mutant slices (animals) | Mutant mean (SEM) | P(animals) | P(mutation) |
|---|---|---|---|---|---|---|---|
| Burst 1, PPF at 10ms, ampl ratio | % | 28 (10) | 178 (4.5) | 36 (11) | 178.6 (3.8) | 1.3e-05 *** | 0.95 |
| Burst 1, EPSP3 depr, ampl ratio | % | 28 (10) | 63.4 (1.9) | 36 (11) | 65.9 (1.8) | 0.0072 ** | 0.49 |
| Burst 1, ave amplitude | µV | 28 (10) | 1473 (61) | 36 (11) | 1365 (35) | 0.39 | 0.14 |
| Burst 2, ave amplitude | µV | 28 (10) | 2365 (114) | 36 (11) | 2166 (69) | 0.39 | 0.15 |
| Burst 3, ave amplitude | µV | 28 (10) | 2618 (115) | 36 (11) | 2409 (70) | 0.4 | 0.13 |
| Burst 4, ave amplitude | µV | 28 (10) | 2661 (105) | 36 (11) | 2460 (68) | 0.47 | 0.11 |
| Burst 5, ave amplitude | µV | 28 (10) | 2602 (97) | 36 (11) | 2418 (64) | 0.51 | 0.11 |
| Burst 6, ave amplitude | µV | 28 (10) | 2514 (89) | 36 (11) | 2349 (62) | 0.56 | 0.12 |
| Burst 7, ave amplitude | µV | 28 (10) | 2428 (89) | 36 (11) | 2269 (60) | 0.51 | 0.14 |
| Burst 8, ave amplitude | µV | 28 (10) | 2365 (85) | 36 (11) | 2206 (62) | 0.5 | 0.14 |
| Burst 9, ave amplitude | µV | 28 (10) | 2288 (82) | 36 (11) | 2145 (62) | 0.48 | 0.17 |
| Burst 10, ave amplitude | µV | 28 (10) | 2255 (85) | 36 (11) | 2101 (63) | 0.37 | 0.17 |
| Burst 2-4 ave amplitude vs Burst 1 | % | 28 (10) | 173.5 (3.9) | 36 (11) | 171.5 (3) | 0.024 * | 0.74 |
| Burst 8-10 ave amplitude vs Burst 2-4 | % | 28 (10) | 90.6 (1.2) | 36 (11) | 91.3 (0.8) | 0.11 | 0.69 |
Long Term Potentiation
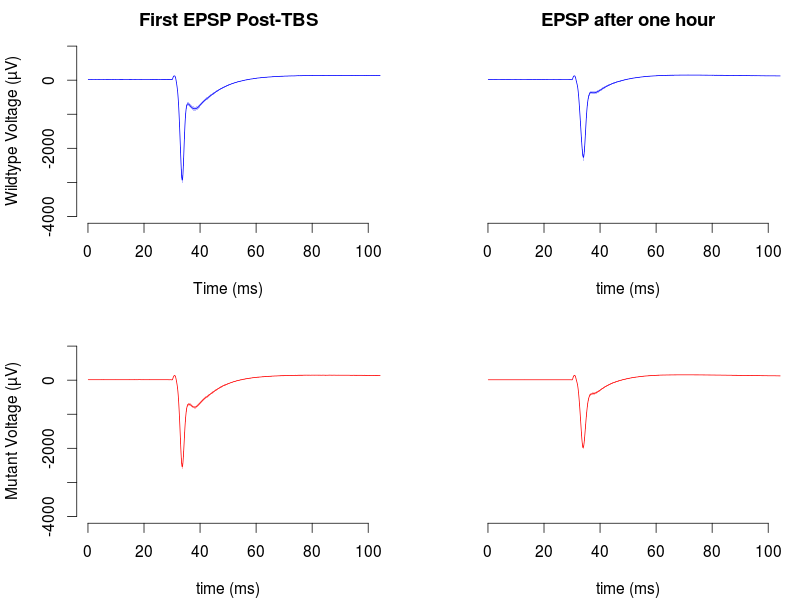

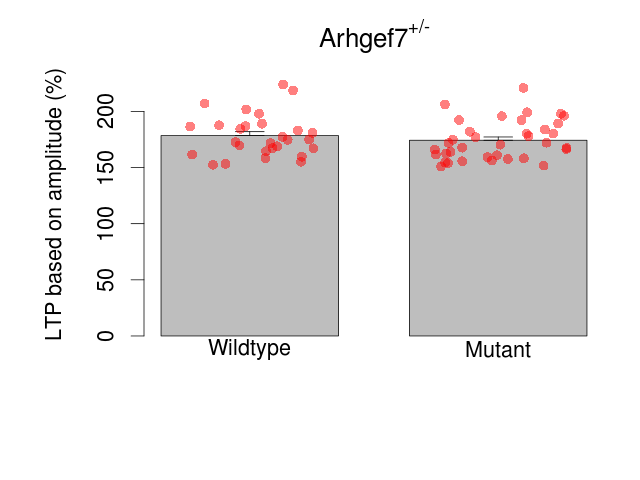
Variables shown are: LTP vs PTP, amplitude ratio, Reduction in potentiation from immediately after theta-burst stimulation to one hour later, fEPSP amplitude ratio. LTP based on amplitude, Long term potentiation, ratio of amplitudes of fEPSPs in test pathway and control pathway.
| Variable | Units | Wildtype slices (animals) | Wildtype mean (SEM) | Mutant slices (animals) | Mutant mean (SEM) | P(animals) | P(mutation) |
|---|---|---|---|---|---|---|---|
| LTP vs PTP, amplitude ratio | % | 28 (10) | 79.5 (1.3) | 36 (11) | 79.4 (0.9) | 0.0099 ** | 0.97 |
| LTP based on amplitude | % | 28 (10) | 178.4 (3.5) | 36 (11) | 174.3 (2.9) | 0.16 | 0.43 |
Hippocampal slice electrophysiology raw data
| Animals and Brain slices | View |
| Field EPSP (Maximum) | View |
| Paired Pulse Facilitation | View |
| Long Term Potentiation | View |
| Data Files | View |